
Open the Summary Report
Choose a public company in Snapshot 360° and open Summary Report. NVIDIA is the educational example shown in this tutorial.

Invest Smartly
03 / Company analysis
Move from financial cards to a conversation grounded in the report you are reading.
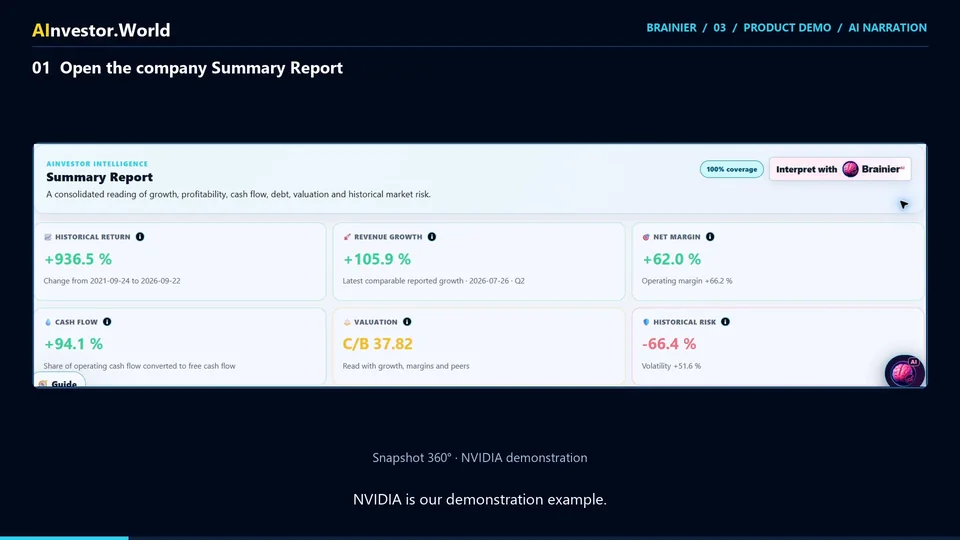
Choose a public company in Snapshot 360° and open Summary Report. NVIDIA is the educational example shown in this tutorial.
Compare reporting periods and examine revenue growth, net margin, cash flow, valuation and historical risk together.
Select Interpret with Brainier. The selected report’s visible values and coverage provide the context, without copying each card into a new prompt.
Ask what a valuation multiple means in this report. Compare the response with the original cards and check the periods and limitations.
Complete English narration. Open a section to read at your own pace.
Now let us move from a general question to a specific company. In Snapshot 360°, open Summary Report. NVIDIA is our demonstration example. The report brings together growth, profitability, cash flow, valuation, and historical risk.
The growth card compares reported revenue periods. Net margin shows the share of revenue left as profit. The cash flow card shows the relationship between operating and free cash flow. Valuation needs to be read alongside growth and profitability. Historical risk describes past fluctuations and drawdowns, not tomorrow's outcome.
Select Interpret with Brainier. This action passes the report's visible values and their coverage into the conversation. You do not need to copy each card into a separate prompt. Brainier can explain the report you were already reading.
Review the explanation against the original cards. Ask a focused follow up, such as what the valuation multiple means in this report. Always check the reporting periods, data coverage, and any limitations. The purpose is to understand the evidence and choose what to research next.
FROM LEARNING TO EXPLORING
Create a free account to explore public companies, financial reports and your research questions.
Educational financial research tools. No personalized investment advice. Check reporting periods, available sources and data coverage.