
Open Portfolio Financial Analysis
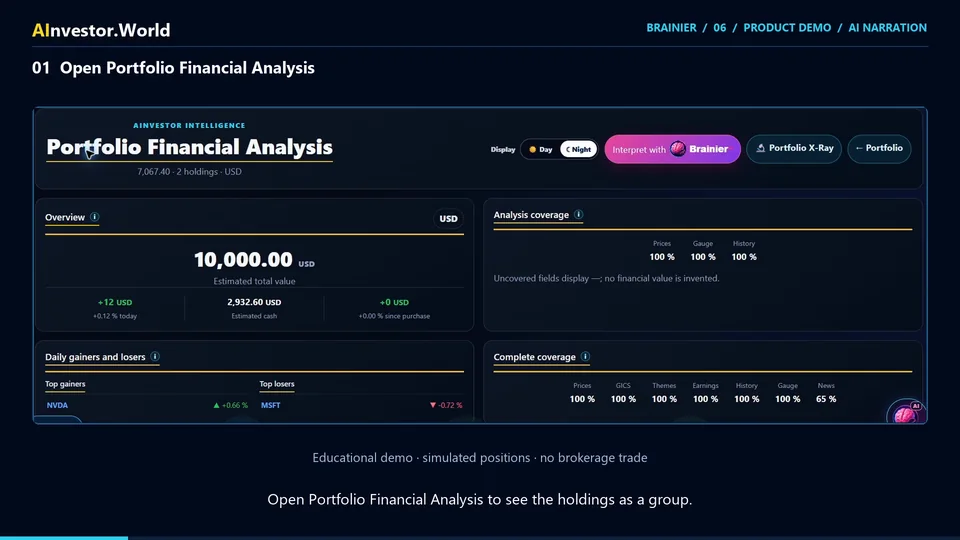
Select a portfolio and open its financial analysis. This tutorial uses simulated NVIDIA and Microsoft positions plus cash.

Invest Smartly
04 / Portfolio research
See how holdings fit together, where exposures overlap and what deserves a closer look.
The video will be available here soon. You can already explore the steps and read the complete narration below.
Select a portfolio and open its financial analysis. This tutorial uses simulated NVIDIA and Microsoft positions plus cash.
Review the overview, diversification, Gauge quality and data confidence. Completeness describes available data, not certainty about future performance.
Compare weights excluding cash, sectors and currencies. A portfolio with several positions can still share concentrated exposures.
Open the portfolio interpretation with Brainier. Ask which holdings drive concentration, which information is missing and what needs further research.
Complete English narration. Open a section to read at your own pace.
Understanding individual stocks is only part of the picture. A portfolio brings those positions together. This educational example uses simulated NVIDIA and Microsoft positions, plus cash. Open Portfolio Financial Analysis to see the holdings as a group.
The overview separates estimated total value and cash. Analysis coverage shows which holdings have prices, scores, and history available. Diversification summarizes concentration. Gauge quality combines available company scores. Data confidence measures completeness, not certainty about future performance. The watch card lists detected alerts.
Read the holdings first. Here, NVIDIA represents about sixty five percent of the invested holdings, excluding cash. Both companies belong to information technology. Currency and sector views reveal shared exposures. Two positions do not automatically make a diversified portfolio.
Open the portfolio interpretation with Brainier. The conversation uses the selected portfolio context, so your question can focus on the overall picture. Ask which positions drive concentration, what information is missing, or which exposures deserve a closer look.
Turn the explanation into research questions. What happens if the largest position falls? Which holdings share a sector or currency? What dates support the displayed values? Review the original portfolio and available analytical cards alongside the answer.
Brainier helps you interpret your portfolio. You remain in control of your research and decisions. These tools provide educational financial analysis, not personalized investment advice. Explore your next question at AInvestor.World.
FROM LEARNING TO EXPLORING
Create a free account to explore public companies, financial reports and your research questions.
Educational financial research tools. No personalized investment advice. Check reporting periods, available sources and data coverage.